ML TIPS & TRICKS / TIDE
A Better mAP for Object Detection
Why does your object detection model suck? Let’s improve it!
TL;DR: Your object detection model sucks and you want to improve it by leveraging better evaluation metrics… skip the introduction, and find out how or go directly to the Google Colab notebook for the code or here for the ClearML experiment log!

Introduction
Object detection is easy. All you need to do is get a training dataset, download a pre-trained model from one of the open-source libraries like Tensorflow Object Detection API, Detectron2, and mmdetection, and (re)train it.
In reality, after training your model for hours, you evaluate it, check the metrics… and you end up completely disappointed with the performance as it’s miles away from what you’ve expected!
Now you’re in trouble… there are no good tutorials, recipes, or StackOverflow topics on how to debug the performance of the model and how to optimize it to achieve better performance. At Forsight, we use TIDE to achieve accurate object detection. This blog is all about sharing tips & tricks that will prove invaluable for improving the accuracy of your object detection model.
Model performance evaluation — basics
There are two key aspects that make up the object detection model performance: speed and accuracy. There’s always a tradeoff between the two as can be seen in the table below. In this blog, we’ll focus exclusively on analyzing the model accuracy.

In a nutshell, object detectors predict the location of objects of a given class in an image with a certain confidence score. Locations of the objects are defined by placing bounding boxes around the objects to identify their position.
Therefore, a detection is represented by a set of three attributes:
- object class (i.e. person)
- corresponding bounding box (i.e. [63, 52, 150, 50])
- confidence score (i.e. 0.583 or 58.3%)
Similarly, the performance evaluation of the object detection model is done based on:
- a set of ground-truth bounding boxes representing the rectangular areas of an image containing objects of the class to be detected,
- a set of detections predicted by a model, each one consisting of a bounding box, a class, and a confidence value.
IoU and confidence score
Consider an object of interest (person) represented by a ground-truth bounding box (green color) and the detected area represented by a predicted bounding box (red color) in the image below. Without taking into account the confidence score, a perfect match occurs when the area and location of the predicted and ground-truth boxes are the same, i.e. perfectly bounding the person.

These two conditions are assessed by the intersection over union (IoU), a measurement based on the Jaccard index, a coefficient of similarity for two sets of data. In the object detection scope, the IoU is equal to the area of the overlap (intersection) between the predicted bounding box (red) and the ground-truth bounding box (green) divided by the area of their union.

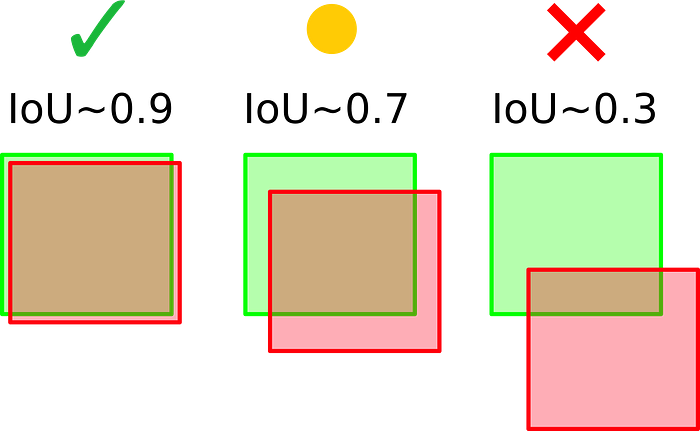
A few examples of different IoU scores can be seen in the image below. By setting an IoU threshold, a metric can be more or less restrictive on considering detections as correct or incorrect. An IoU threshold closer to 1 is more restrictive as it requires almost perfect detections, while an IoU threshold closer to, but different than 0 is more flexible, considering even small overlaps as valid detections.
The confidence score reflects how likely the box contains an object of interest and how confident the classifier is about it. If no object exists in that box, the confidence score should ideally be zero. In general, the confidence score tends to be higher for tighter bounding boxes (strict IoU).
Precision and recall
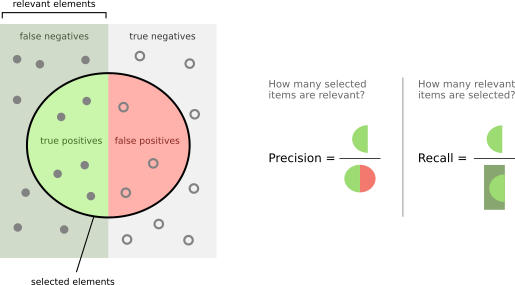
Precision (Pr) is the ability of a model to identify only relevant objects and is calculated as the percentage of correct positive predictions.
Recall (Rc) is the ability of a model to find all relevant cases (all ground-truth bounding boxes). It is the percentage of correct positive predictions among all given ground truths.
To calculate the precision and recall values, each detected bounding box must first be classified as:
- True-positive (TP) — a correct detection of a ground-truth bounding box;
- False-positive (FP) — incorrect detection of a non-existing object or a misplaced detection of an existing object;
- False-negative (FN) — an undetected ground-truth bounding box;
- True Negative (TN) — does not apply to object detection because there are infinitely many instances that should not be detected as objects.
To recap, the output of an object detector is characterized by a bounding box, a class, and a confidence score. The confidence score can be taken into account in the precision and recall calculations by considering as positive detections only those whose confidence is larger than a confidence threshold τ. The detections whose confidence level is smaller than τ are considered as negatives.
Both TP(τ) and FP(τ) are decreasing functions of τ, as a larger τ reduces the number of positive detections. Conversely, FN(τ) is an increasing function of τ, since less positive detections imply a larger number of negative detections.


Average Precision (AP)
The precision-recall (PR) curve is a plot of precision as a function of recall. It shows the trade-off between the two metrics for varying confidence values for the model detections. AP@α is the Area Under the precision-recall curve (AUC-PR). Mathematically, AP is defined as:

Notation: AP@α means Average Precision(AP) at the IoU threshold of α. Therefore AP@0.50 and AP@0.75 mean AP at IoU threshold of 50% and 75% respectively.
A high AUC-PR implies high precision and high recall. Naturally, the PR curve has a zig-zag behavior (not monotonically decreasing). Before calculating the AP, we make the PR curve to be monotonically decreasing using the following interpolation formula:

After we calculate the AP for each individual class, we calculate the mean AP as an average of all AP for all classes:

For an example of precision-recall curve calculation with a numerical example, please check a great blog post by Harshit Kumar.
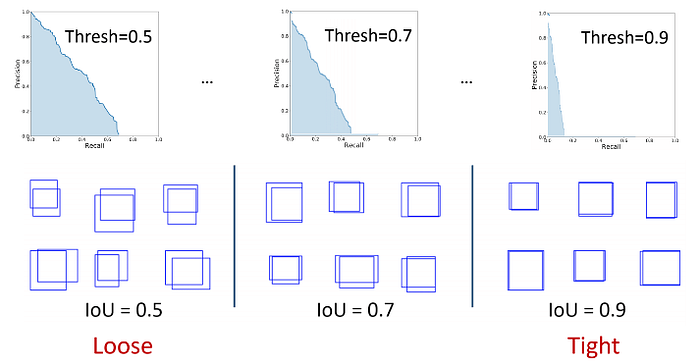
In the image below, we can see three different PR curves and they differ by the IoU threshold used in the precision/recall calculation. Since the AP corresponds to the area under the curve, it is obvious that a loose IoU threshold results in a higher AP score than a strict IoU threshold.
For more details about the specifics of the COCO mAP metric visit: https://cocodataset.org/#detection-eval!
TIDE — a better mAP
As shown in the previous sections, object detection, and instance segmentation tasks usually only use one metric to benchmark model performance: mean Average Precision (mAP). While mAP succinctly summarizes the performance of a model in one number, disentangling errors in object detection and instance segmentation from mAP is difficult: a false positive can be a duplicate detection, misclassification, mislocalization, confusion with background, or even both misclassification and mislocalization.
TIDE (Toolkit for Identifying Detection and segmentation Errors) was introduced to solve the aforementioned challenge. It segments the object detection errors into six types and introduces a technique for measuring the contribution of each error in a way that isolates its effect on overall performance. TIDE is basically COCO mAP on steroids!
If your object detection model has a low mAP after training it on a custom dataset, you’ll for sure want to know where we can improve it additionally. This is where TIDE shines in all its glory. TIDE will help you pinpoint the exact type of error you should focus on improving in order to make your model run better.

TIDE error types
In the paper, there’s a detailed explanation of the error types and how they are defined.
In order to create a meaningful distribution of errors that captures the components of mAP, we bin all false positives and false negatives in the model into one of 6 types as depicted in the figure below. Note that for some error types (classification and localization), a false positive can be paired with a false negative. We will use IoUᵐᵃˣ to denote a false positive’s maximum IoU overlap with a ground truth of the given category.
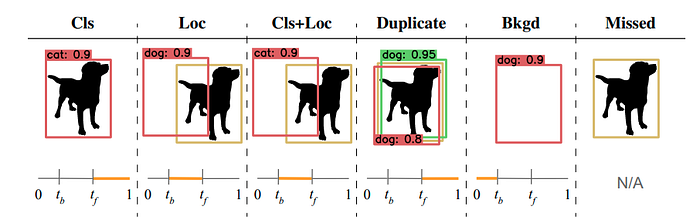
The foreground IoU threshold is denoted as tᶠ and the background threshold is denoted as tᵇ, which are set to 0.5 and 0.1 unless otherwise noted.
1. Classification Error: IoUᵐᵃˣ ≥ tᶠ for GT of the incorrect class (i.e., localized correctly but classified incorrectly).
2. Localization Error: tᵇ ≤ IoUᵐᵃˣ ≤ tᶠ for GT of the correct class (i.e., classified correctly but localized incorrectly).
3. Both Cls and Loc Error: tᵇ ≤ IoUᵐᵃˣ ≤ tᶠ for GT of the incorrect class (i.e., classified incorrectly and localized incorrectly).
4. Duplicate Detection Error: IoUᵐᵃˣ ≥ tᶠ for GT of the correct class but another higher-scoring detection already matched that GT (i.e., would be correct if not for a higher scoring detection).
5. Background Error: IoUᵐᵃˣ ≤ tᵇ for all GT (i.e., detected background as foreground).
6. Missed GT Error: All undetected ground truth (false negatives) not already covered by classification or localization error.
TIDE is meant as a drop-in replacement for the COCO Evaluation toolkit, and getting started is pretty easy:
from tidecv import TIDE, datasets

tide = TIDE()
tide.evaluate(datasets.COCO(), datasets.COCOResult('path/to/your/results/file'), mode=TIDE.BOX)
tide.summarize()  # Summarize the results as tables in the console
tide.plot()       # Show a summary figure
TIDE practical examples
We’ve prepared a Google Colab notebook with a code sample that shows how to use TIDE with Tensorflow Object Detection API.
If you don’t want to run the notebook and wait for the eval to finish, you can check the results on the Allegro ClearML dashboard which we use for experiment management. By using ClearML, we can persistently store all the experiment data in an organized way which enables us to easily perform comparisons and upload custom artifacts such as ground-truth and detection metadata in COCO format, as well as custom plots to the experiment.


By comparing COCO evaluation results for EfficientDet-D0 and EfficientDet-D7 models, we see that EfficientDet-D7 has a higher mAP by ~15%. This is due to the larger capacity of the model — there are ~13x more parameters in EfficientDet-D7 compared to EfficentDet-D0.
Note: There are some known discrepancies between mAP calculation in TIDE and pycocotools. That is the reason why the COCO mAP and TIDE mAP aren’t equal in certain cases.
When comparing the TIDE evaluation results, we can see that the classification and duplicate detection errors are similar for both of the models, while the localization error is 2% lower for the D7 model.
Error in detecting background as the foreground is higher 2% for the D7 model, while the missed GT error is 3.5% smaller for the D7 model compared to the D0. This can be explained by the fact that the D7 model has a higher recall rate which lowers the missed GT error, but at the same time, it increases the background classification error.
The interesting part of the comparison is the mAP for false positives and false negatives. We can see that the false positive rate is very similar between the two models. This can be a sign that there is some unlabeled data in the dataset and that the model is detecting it with high confidence. On the other hand, the false-negative rate is significantly lower for the D7 model. It is obvious that the larger model can detect object instances which the smaller capacity model struggles with.
In this comparison, we’ve compared the same model architecture (EfficientDet) with a different number of parameters (D0 vs D7). TIDE model evaluation is even more useful when we want to compare different model architectures, so feel free to try it yourself. TIDE paper [1] contains additional analysis on different object detection and segmentation models.
TIDE plots for the previous analysis are available below.


Conclusion
Recently, AI pioneer Andrew Ng launched a campaign for data-centric AI where his main goal is to shift the focus of AI practitioners from model/algorithm development to the quality of the data they use to train the models. While high-quality data indeed is the key to achieving the high-performance of the models, the models also play a key role: models and data cannot be completely decoupled. Only the focus can be switched from one to the other during the development process, depending on the bottlenecks identified by in-depth analysis.
At Forsight, we found that understanding the performance of object detection models must go beyond vanilla frames-per-second (FPS) and mAP-based accuracy metrics. It is incredibly important not just to naively benchmark the models, but to understand what you should do to further improve their performance.
Using more insightful metrics like those provided by TIDE makes it much easier to identify specific problems in your dataset such as unlabeled images, loose bounding boxes, etc. It also helps you identify situations where your model capacity just isn’t large enough for the specific task at hand. Solving these problems one by one will eventually lead you to significantly better machine algorithms, and help you create production-ready models for real-world applications!
We hope that you found this blog post useful, please take a look at some other blogs written by our team at Forsight, and feel free to reach out to us at info@forsight.ai if you have any questions!
References
- Daniel Bolya, Sean Foley, James Hays, and Judy Hoffman; TIDE: A General Toolbox for Identifying Object Detection Errors, ECCV 2020.
- Padilla, Rafael, Passos, Wesley L., Dias, Thadeu L. B., Netto, Sergio L. and da Silva, Eduardo A. B.; A Comparative Analysis of Object Detection Metrics with a Companion Open-Source Toolkit, Electronics 2021., https://doi.org/10.3390/electronics10030279
- Tushar Kolhe; How to boost object detection accuracy by understanding data, https://blog.gofynd.com/boost-object-detection-model-accuracy-552586d698c
- Adam Kelly; Create COCO Annotations From Scratch, https://www.immersivelimit.com/tutorials/create-coco-annotations-from-scratch
- Kiprono Elijah Koech; Object Detection Metrics With Worked Example https://towardsdatascience.com/on-object-detection-metrics-with-worked-example-216f173ed31e
- Harshit Kumar; Evaluation metrics for object detection and segmentation - mAP, https://kharshit.github.io/blog/2019/09/20/evaluation-metrics-for-object-detection-and-segmentation

